
Private debt is popular today. If you’ve been around institutional investors as of late, I dare say that it’s all the rage.
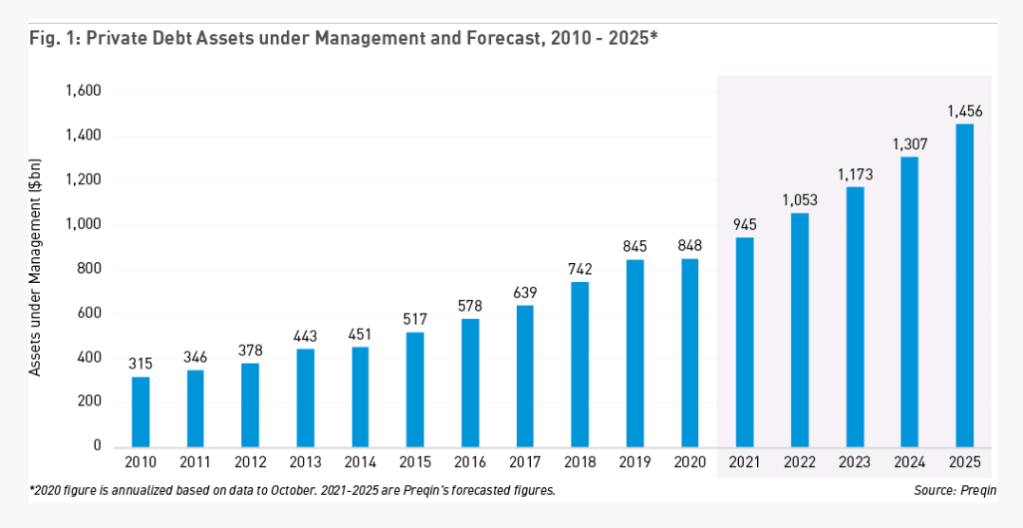
Preqin is among the most frequently cited databases in the private asset space. Their data and many of their insights are behind a paywall so I don’t have access to the most recent data, but the chart below shows the historical private debt AUM growth with predictions till 2025.
During a period of rising rates, the floating rate nature of private debt makes them more resilient than most fixed income indices you’ll see, largely because of the dominance of fixed coupon issuances. Secondly, a credit crunch seems to be underway. The pro-cyclicality of bank credit means that there may be more opportunities that banks are more reluctant to fund leading to higher yields in the private debt space. But can you really get something out of private debt that you can’t in the public markets? Are you really getting something that isn’t possible with say, floating rate high yield debt?
In a Financial Analysts Journal Article, “Private Debt Fund Returns, Persistence and Market Conditions”, Boni and Manigart examine the characteristics of these funds from 1996-2020. What is most interesting to me, however, is the fact that they use the Kaplan and Schoar Public Market Equivalent (PME) methodology.
The PME is the ratio of the present value of distributions to the present value of contributions discounted at the rate of the benchmark you’d like to compare the returns to.

Distributions here are on an after-fee basis, paid to limited partners. Sums are calculated from the beginning (s = t0) to the end of the fund (time = t). This method is flexible to the choice of index, (1 + Rms) would be the rate of return for the relevant benchmark.
This flexibility is necessary. It would be unfair to compare a relatively high yield private credit fund to a universe of securities dominated by investment grade government debt. This applies to private equity funds too; growth equity and LBO funds should probably be compared to growth indexes and large/mid cap value indices. In other cases, they may not perfectly match any existing benchmark.
In any case, let’s return to private debt. A PME exceeding one means that it outperforms the relevant benchmark. I won’t post the tables here since I don’t think the publication itself is for public consumption (it’s behind a paywall). But I will talk about its findings relative to some benchmarks.
Median PME relative to investment grade bonds (corporate rather than government for reasons of comparability) was 1.05; slightly higher. Median PME relative to high yields was similar at 1.04. I find this very surprising. Sure, a 1.04 PME likely won’t make or break your portfolio anytime soon, though it will add up. But what I find interesting is that these are after fee returns.
When you buy the IG or HY bond indices, you don’t get the returns. You pay a fee to the asset manager. For example, XCB, the Blackrock Canadian IG Corporate ETF, charges a fee of 0.17%. XHY, their passive high yield product, would cost you 0.66%. But private investment funds are much more expensive. The journal article in question places fees at 1.5% to 2% for committed capital and an additional 15% to 20% calculated on the excess the fund receives above a 6% to 8% hurdle rate. In other words, they follow the typical private equity fund fee. These funds also charge other fees for things like transactions and advisory.
To achieve similar returns to publicly listed HY and IG means that you’d have to be looking at a pre-fee alpha of what, 4%? 5%? The paper isn’t clear about some average fee amount but that seems quite incredible when you’re talking about debt markets.
Now of course, the 1996-2020 period means that there was far less capital in this space than their is today. In other words, if there was a systematic undervaluation of private debt assets, the flow of capital might progressively make markets more efficient, thereby reducing fees.
Anyways, an interesting look at the asset class. Perhaps I’ll dig deeper in to this later.
DISCLAIMER: I am not a financial advisor. Nothing on this website is to be constituted as financial advice. All content here is solely for educational purposes. They solely represent the opinion of the author.
